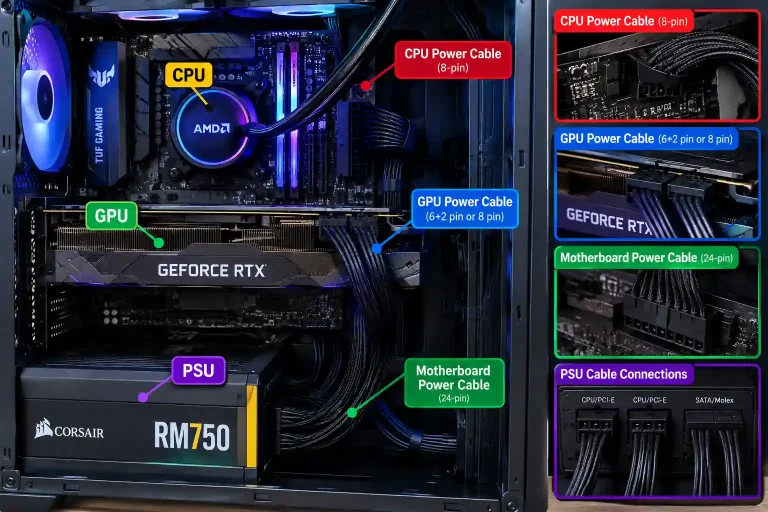
How to Monitor PC Performance While Gaming: The Complete FPS, Temperature & Bottleneck Guide
Your frame counter says 140 FPS, yet the game still feels choppy. A firefight starts, everything stutters for half a second, and you’re already dead. Was it your GPU? Your CPU? A background app eating your RAM?
Most gamers guess. They blame the graphics card, buy an upgrade, and the stutter comes back a week later because the FPS number on screen never told them the real story.
Learning how to monitor PC performance while gaming is the fastest way to stop guessing. Once you know which metrics actually matter and how to read them, you can pinpoint the exact part of your build that’s holding you back before you spend a single dollar on new hardware.
This guide walks through every metric worth tracking, the best free monitoring software for gamers, and how to turn those numbers into a clear diagnosis.
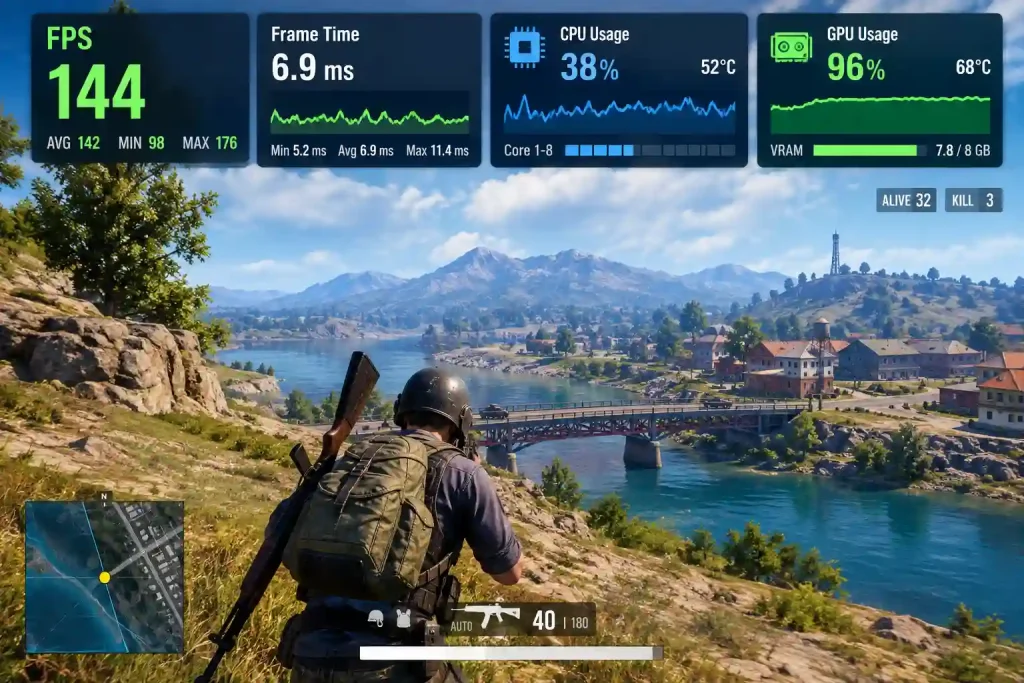
Table of ContentsShow or hide all 9 sectionsShowHide
Why Performance Monitoring Matters More Than the FPS Counter
A single FPS number is an average. Averages hide problems. A game can average 90 FPS and still feel terrible if it dips to 15 FPS every few seconds during an explosion or a busy scene.
Real PC performance monitoring for gamers means watching several numbers together frame consistency, hardware usage, and temperatures instead of one number in the corner of your screen. That’s the only way to tell whether a stutter is caused by your hardware, your settings, or something running quietly in the background.
The Core Metrics You Need to Track While Gaming
FPS vs. Frame Time: Why the Average Number Lies
FPS (Frames Per Second) tells you how many frames render each second, but it’s an average across that entire second. It can look smooth on paper while feeling rough in your hands.
Two numbers matter far more than the average:
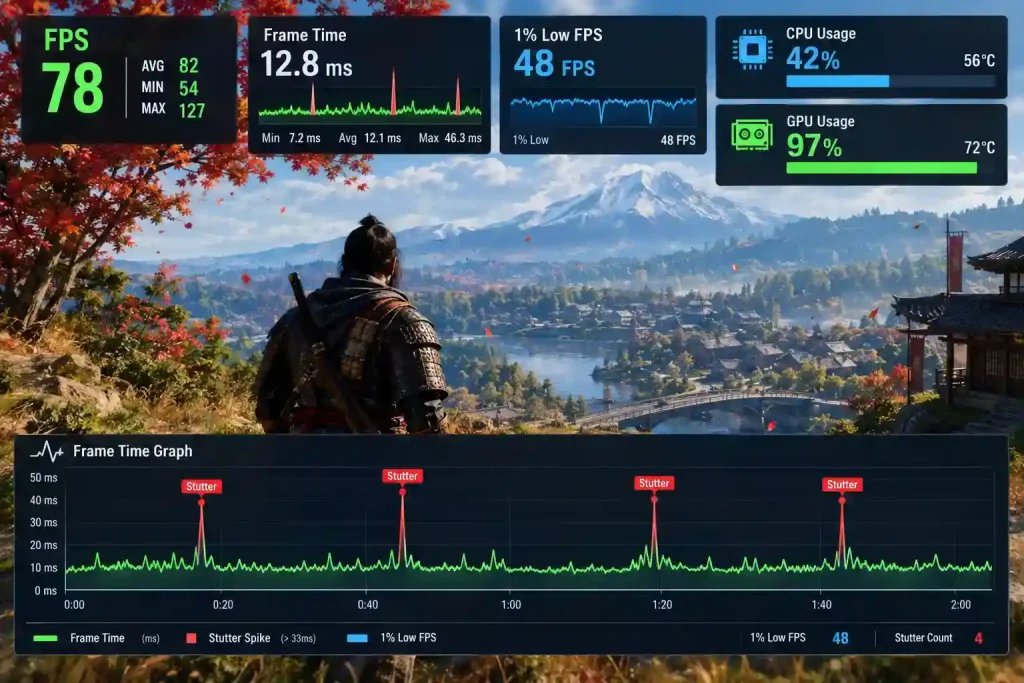
- 1% Lows the average of the worst 1% of frames. If your average is 140 FPS but your 1% low is 30, those low points are what you actually feel as stutter.
- 0.1% Lows an even stricter measure of your absolute worst moments, useful for competitive games where a single freeze can cost you a match.
- Frame Time how long each individual frame takes to render, measured in milliseconds. A flat line is smooth gameplay; spikes on the graph mean stutter, regardless of what the FPS counter reads.
For reference, 60 FPS needs a steady 16.6ms frame time, and 144 FPS needs roughly 6.9ms. Consistency matters more than the peak number.
What Counts as a “Good” 1% Low?
A healthy target is keeping your 1% low within about 20–30% of your average FPS. If your average is 100 FPS and your 1% low drops to 40, that gap is worth investigating it usually points to a CPU bottleneck, background software, or a thermal issue.
GPU Usage: What’s Normal While Gaming
GPU usage is one of the few metrics where higher is better. 95–99% GPU usage while gaming means your graphics card is being used to its full potential you’re getting what you paid for.
CPU Usage Per Core, Not Total
This is where most gamers misread their own hardware. Task Manager might show “35% CPU usage” and look completely safe. But that’s an average across every core. Most games only lean heavily on two to four cores.
If even one core is pinned at 100% while the rest sit idle, that single core is the ceiling on your performance a classic CPU bottleneck even though the overall usage number looks low.
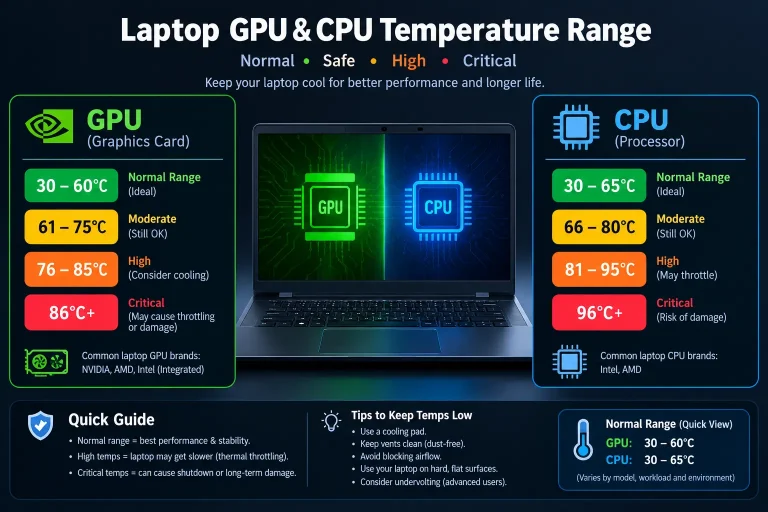
Temperatures and Thermal Throttling
When a chip gets too hot, it deliberately slows itself down to avoid damage. This is called thermal throttling, and it feels exactly like hitting an invisible wall mid-game.
| Hardware | Normal Load Range | Throttle Point | Notes |
| Intel Core (13th/14th Gen) | 70–85°C | ~100°C | Short spikes to 90°C are normal under heavy load |
| AMD Ryzen (7000/9000 series) | Up to 90°C | ~95°C | Runs hotter by design; this is expected |
| NVIDIA RTX 40-series GPU | 65–75°C | ~83–84°C | Keep it cooler for higher sustained boost clocks |
RAM and VRAM Usage
Once system RAM hits 95–100%, Windows starts paging to your storage drive, which is dramatically slower than RAM and causes visible stuttering. The same logic applies to VRAM load 4K textures on an 8GB graphics card and the game has to swap data in and out, hitching every time it does.
Best Free Tools to Monitor FPS, Temps, and Usage While Gaming
You don’t need paid software to get a full picture of your system. Here’s what actually gets used by people who take PC performance monitoring seriously.
MSI Afterburner + RivaTuner Statistics Server (RTSS)
This combination is the closest thing to an industry standard. Afterburner reads your hardware sensors; RTSS draws the customizable on-screen overlay so you can watch FPS, frame time, CPU-core loads, temperatures, and VRAM usage live, on top of your game.
One caveat: if you’re running DLSS 3 Frame Generation, some overlays undercount AI-generated frames. Keep RTSS updated to the latest version, or trust the game’s own frame counter for the most accurate number.
HWiNFO64 for Deep Sensor Data
If you want to dig deeper than Afterburner shows by default voltages, individual VRM temps, per-core clock speeds HWiNFO64 is the free tool most enthusiasts fall back on. It can also feed its sensor data directly into an RTSS overlay.
Windows Task Manager and Xbox Game Bar
Built into Windows, and genuinely useful for a fast sanity check. Press Win+G to open Game Bar, or open Task Manager’s Performance tab on a second monitor. The graphs are basic, but it’s the quickest way to confirm whether RAM or CPU is maxed out without installing anything.
NVIDIA App / AMD Adrenalin Overlay
Both GPU makers bundle a lightweight overlay. NVIDIA users can hit Alt+R; AMD users press Ctrl+Shift+O. These are fine for a quick glance at FPS and temps but offer far less detail than a dedicated overlay tool like Afterburner.
Intel PresentMon
A more technical option, PresentMon breaks down exactly how a frame spends its time including “GPU Busy” time versus time spent waiting on the CPU. It’s a favorite among people who want to isolate a bottleneck with precision rather than guess from a general-purpose overlay.
How to Set Up an In-Game Performance Overlay
- Install MSI Afterburner and RTSS together they’re bundled in the same download from MSI’s site.
- Open the Afterburner settings, go to the “Monitoring” tab, and tick the boxes for the metrics you want tracked: FPS, frame time, per-core CPU usage, GPU usage, temperatures, and RAM/VRAM.
- Check “Show in On-Screen Display” next to each metric you selected.
- Set a toggle hotkey under RTSS settings so you can show or hide the overlay mid-game without alt-tabbing out.
- Launch your game and confirm the overlay appears in a corner that doesn’t block anything important most players prefer the top-left.
- Play a demanding scene for a few minutes, then review the numbers rather than trying to read them live while you’re being shot at.

How to Diagnose a CPU vs. GPU Bottleneck From Your Numbers
Once you’ve got a session of real data, here’s how to read it.
Signs You’re GPU-Bound (This Is the Goal)
GPU usage sits at 95–99%, while your CPU cores stay comfortably under 80%. Your graphics card is the limiting factor, which is exactly how it should work you’re extracting full value from what you paid for it.
Signs of a CPU Bottleneck
GPU usage drops to 60–70% or lower, even though your FPS isn’t where it should be, and one or two CPU cores are pegged near 100%. Your processor can’t feed the GPU new frames fast enough, so the graphics card sits partly idle waiting on it.
Signs of a RAM or VRAM Bottleneck
Stutters line up precisely with the moments your RAM or VRAM usage graph hits its ceiling loading into a new area, texture-heavy scenes, or alt-tabbing with several background apps open.
Alt text: “Chart comparing CPU bottleneck vs GPU bottleneck usage patterns while gaming”
Confirm the Diagnosis With a Bottleneck Calculator
Reading live overlay data takes practice, and it’s easy to misjudge a single stutter as a bigger problem than it is. Once you’ve spotted a pattern in your monitoring software, it helps to cross-check it against your actual hardware specs.
A tool like the free PC bottleneck calculator at BottleneckCalculator lets you enter your CPU, GPU, RAM, and target resolution to see the expected balance of your build. If your overlay shows low GPU usage during gameplay and the calculator also flags a CPU-side bottleneck for your exact combination, you can upgrade with real confidence instead of a guess.
Common Causes of Poor Gaming Performance and Free Fixes
Before spending money on new parts, rule out these free fixes first.
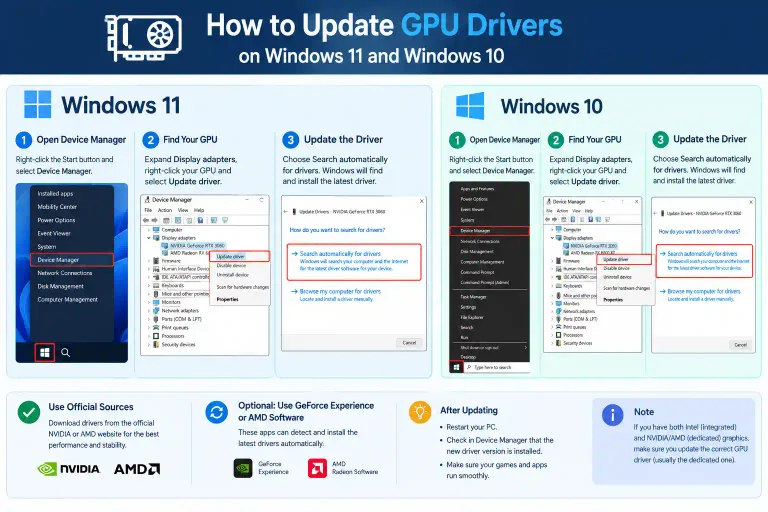
Outdated GPU Drivers
“Game Ready” driver updates regularly add 5–15% FPS gains in newer titles, plus fixes for stutter and crashes specific to certain games.
Background Apps and Competing Overlays
Dozens of open browser tabs, chat apps, and recording software all compete for RAM and CPU time. Running more than one overlay tool at once (Afterburner and Discord and GeForce Experience, for example) can also cost you a few extra frames for no benefit pick one.
RAM Running Below Its Rated Speed
Check your BIOS for XMP (Intel) or EXPO (AMD). Without it enabled, fast DDR5 memory often runs at a slow default speed like 4800MHz instead of its rated 6000MHz, which creates a real CPU-side bottleneck, particularly on Ryzen platforms.
Dust, Airflow, and Old Thermal Paste
A GPU or CPU choked with dust, or thermal paste that’s a few years old, can push temperatures high enough to trigger throttling well before the chip’s rated limit. A clean-out and repaste is one of the cheapest performance fixes available.
Settings That Don’t Match Your Hardware
If you’re GPU-bound, turning down expensive settings like volumetric clouds, ray-traced shadows, and ambient occlusion often recovers significant FPS with minimal visual difference.
When Your Monitoring Data Says It’s Time to Upgrade
- Upgrade your GPU if it consistently sits at 99% usage, your settings are already turned down, and FPS still isn’t where you want it.
- Upgrade your CPU if GPU usage regularly sits below 90% while frame rates are low and inconsistent your processor can’t keep up.
- Add or upgrade RAM if usage repeatedly maxes out and stutters line up with those spikes, especially when multitasking alongside a game.
Whichever part your data points to, run the specific upgrade through a bottleneck calculator first to confirm the new part actually removes the ceiling instead of just moving it somewhere else in your build.
Frequently Asked Questions
How do I check my FPS and temps while gaming for free?
MSI Afterburner paired with RivaTuner Statistics Server (RTSS) is free and gives you a full on-screen overlay for FPS, frame time, temperatures, and usage. For a quicker built-in option, NVIDIA users can press Alt+R and AMD users can press Ctrl+Shift+O.
How can I tell if my CPU is bottlenecking my GPU while gaming?
Watch your GPU usage with an uncapped frame rate. If it sits below 90–95% while your FPS is lower than expected, your CPU likely can’t keep up, and the graphics card is left waiting on it between frames.
What is a safe GPU temperature while gaming?
Most modern GPUs run comfortably in the 65–80°C range under load. Thermal throttling generally begins somewhere around 83–90°C depending on the specific card.
Why does my FPS look fine but the game still feels laggy?
This is usually micro-stutter — your average FPS is healthy, but frame time is inconsistent. Check your 1% low FPS; a big gap between your average and your 1% low is what you’re actually feeling.
Does running monitoring software lower my FPS?
A single overlay tool like MSI Afterburner typically costs only 1–2 FPS. Running several overlays simultaneously, though, can add up and cause its own slowdown — stick to one.
What’s a good frame time target for smooth gameplay?
For 60 FPS, aim for a steady 16.6ms. For 144 FPS, aim for around 6.9ms. A flat, consistent line matters more than shaving off a millisecond or two.
Is 100% CPU usage always bad while gaming?
If a core is pinned at 100% with nothing left in reserve for background tasks or new game data, you’ll typically see stutter and input lag. It’s one of the clearest signs of a CPU-limited system.
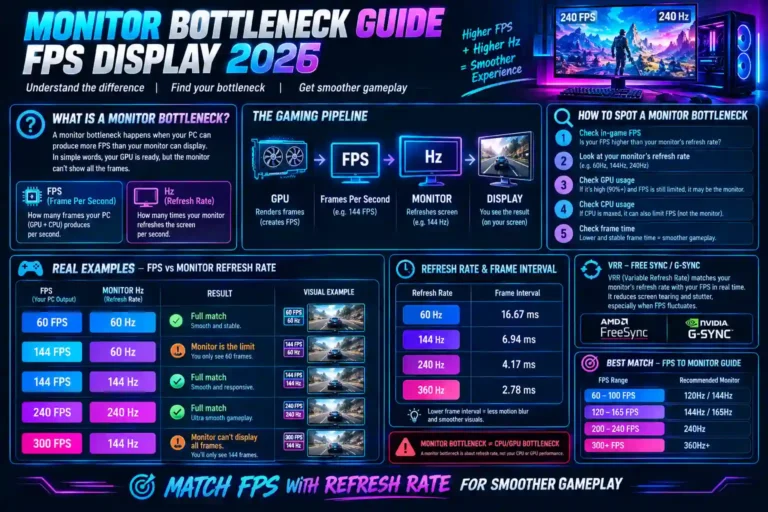
Can my monitor itself cause a performance bottleneck?
Yes, in a practical sense. If your PC renders 200 FPS but your monitor only refreshes at 60Hz, you’ll only ever see 60 of those frames per second. Matching your monitor’s refresh rate to your typical FPS is the only way to actually see the performance your hardware is producing.
Final Thoughts
Monitoring your PC while gaming isn’t about chasing a bigger number in the corner of the screen it’s a diagnostic habit. Track your 1% lows and frame time, keep an eye on temperatures, and watch CPU and GPU usage together rather than in isolation.
Once your overlay data shows a pattern, confirm it with a free bottleneck calculator before you spend money on new hardware. It’s the difference between an upgrade that actually fixes the stutter and one that just moves the bottleneck somewhere else in your build.