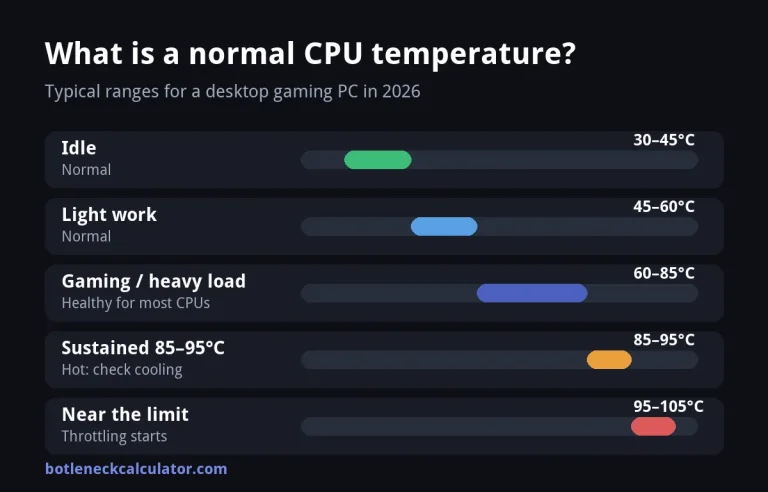
Quick answer: Windows 11 has no built-in CPU temperature monitor, so install a free tool such as HWiNFO (most detail) or Core Temp (simplest), or check the BIOS/UEFI. A healthy CPU idles around 30–45°C and stays roughly 60–85°C while gaming. Most modern chips start throttling near 95–105°C, depending on the model.
If your PC slows down after 15 minutes of gaming, fans scream during light work, or the screen freezes for no reason, heat is the first thing to rule out. The good news: you rarely need new parts. You need numbers. This guide shows how to read them, which tool to trust, and what to do when they look wrong.
Table of ContentsShow or hide all 17 sectionsShowHide
Key Takeaways
Windows does not show CPU temperature. You need HWiNFO, Core Temp, HWMonitor, or the BIOS.
Idle 30–45°C, gaming 60–85°C is a healthy zone for most desktops. Laptops run hotter.
Tjmax differs by chip. Most Ryzen 7000/9000 chips sit at 95°C, X3D models like the 7800X3D at 89°C, and the Intel Core Ultra 9 285K at 105°C. Check the table below or your CPU’s spec page.
Throttling is not the same as a bottleneck. Throttling appears as heat builds. A bottleneck is a constant ceiling.
Calculators are a starting point only. Confirm any bottleneck calculator result with real monitoring.
Table of Contents
What is CPU temperature monitoring?
Safe CPU temperature ranges (2026)
Best CPU temperature monitoring tools
How to read the numbers
How to run a proper heat test
Thermal throttling vs CPU bottleneck
Does a bottleneck calculator work?
GPU scheduling and your CPU load
Which graphics card for a gaming PC in 2026?
How to lower CPU temperature
Laptop vs desktop
FAQs
What Is CPU Temperature Monitoring?
CPU temperature monitoring means reading the thermal sensors built into your processor (and motherboard) while the PC runs, then watching how those readings change between idle and heavy load. Software shows you the core temperatures, the package temperature (the overall CPU reading), and the clock speed, which drops when the chip is too hot.
Why it matters: when a CPU gets too hot it protects itself by lowering its clock speed. That is called thermal throttling, and you feel it as stutter, lower FPS and slow exports. Watching temperature lets you catch the problem early instead of guessing.
Safe CPU Temperature Ranges (2026)
There is no single perfect number, because room temperature, cooler quality and CPU model all change the result. These are practical targets for desktop PCs:
Situation
Typical range
What it means
Idle (desktop, browser)
30–45°C
Normal. Hot rooms can add 5–10°C
Light work (office, video)
45–60°C
Normal
Gaming / heavy load
60–85°C
Healthy for most CPUs
Sustained 85–95°C
Hot
Cooler is struggling; investigate
Near Tjmax
95–105°C
Throttling begins
Sources agree on the broad picture: roughly 30–45°C idle and 65–85°C in games, with trouble starting when you sit above about 90–95°C during play.
Maximum temperature (Tjmax) of popular CPUs
Tjmax is the highest junction temperature a chip is designed to reach before it protects itself. It is not a target. The values below come from the official AMD and Intel specification pages, so you can trust them more than a copied chart.
AMD Ryzen
CPU
Tjmax
Typical use
Ryzen 9 9950X3D
95°C
High-end gaming + work
Ryzen 7 9800X3D
95°C
High-end gaming
Ryzen 7 9700X
95°C
Mid/high gaming
Ryzen 5 9600X
95°C
Mid-range gaming
Ryzen 9 7950X
95°C
Heavy multitasking
Ryzen 9 7950X3D
89°C
High-end gaming + work
Ryzen 7 7800X3D
89°C
High-end gaming
Ryzen 7 7700X
95°C
Mid/high gaming
Ryzen 5 7600X
95°C
Mid-range gaming
Ryzen 7 5800X3D
90°C
Gaming (AM4)
Ryzen 7 5800X
90°C
Gaming (AM4)
Ryzen 5 5600X
95°C
Budget gaming (AM4)
Intel Core
CPU
Tjmax
Core Ultra 9 285K
105°C
Core i9-14900K
100°C
Core i7-14700K
100°C
Core i5-13600K
100°C
Core i9-12900K
100°C
Core i5-12400F
100°C
Two things stand out. First, X3D chips (7800X3D, 7950X3D) top out at 89°C, lower than most Ryzens, so the same 88°C that is fine on a Ryzen 7700X is already at the limit on an X3D. Second, Ryzen 5000 chips differ from each other: the 5800X and 5800X3D are 90°C, while the 5600X is 95°C. Don’t assume one number for a whole family.
Tip: Not listed? Search “[your CPU name] Tjmax” and open the official AMD or Intel page. Desktop chips usually list the value under “Max. Operating Temperature” in the specifications.
Best CPU Temperature Monitoring Tools
Windows 11 does not include a CPU temperature view, so you need one of these. All are free for personal use.
Quick comparison
Tool
Best for
Difficulty
Shows per-core temps
Throttling info
HWiNFO
Full detail, logging
Medium
Yes
Yes
Core Temp
Quick, simple reading
Easy
Yes
Limited
HWMonitor
Middle ground, min/max values
Easy
Yes
No
Open/Libre Hardware Monitor
Open-source, lightweight
Easy
Yes
No
MSI Afterburner (+RTSS)
CPU + GPU overlay while gaming
Medium
Yes
Partial
BIOS / UEFI
Reading without Windows
Easy
Varies
No
1. HWiNFO: best overall
HWiNFO reads almost every sensor on the motherboard, CPU and GPU, and it is the tool most reviewers rely on. It is the best choice when you want to know why something is hot.
How to use it:
Download HWiNFO from the official site and run it.
Choose Sensors-only at startup.
Scroll to the CPU section and watch CPU Package, the Core temperatures, Core clocks, and the thermal throttling rows.
Leave it open while you game or render. Check the Max column afterwards.
Pros: most detail, shows throttling flags, can log data. Cons: a wall of numbers can confuse beginners.
2. Core Temp: best for beginners
Core Temp is a tiny app that shows every core’s temperature and little else, which is exactly why people like it. It also puts the temperature in your system tray.
How to use it: install it, open it, and read the Temperature Readings section. Enable “Start Core Temp with Windows” in settings if you want it running all the time.
Pros: simple, light, per-core history. Cons: CPU only.
3. HWMonitor: simple min/max view
HWMonitor sits between the two above: more than Core Temp, less overwhelming than HWiNFO. It lists temperatures, voltages, fan speeds, power and storage health, with Min and Max values so you can see your peak after a gaming session.
4. Open Hardware Monitor / Libre Hardware Monitor
Free, open-source and portable (no install needed). It reads CPU, GPU, fan and drive temperatures and can expose data to other tools. Libre Hardware Monitor is the actively maintained fork, so try that if Open Hardware Monitor misreads a newer CPU.
5. MSI Afterburner with RTSS: best for gaming overlay
If you want to see temperature and usage on screen during a game, Afterburner with RivaTuner Statistics Server (RTSS) can overlay CPU temp, CPU usage, GPU usage and FPS. This overlay is also the easiest way to run your own bottleneck test (more below).
6. BIOS / UEFI: no software needed
Restart, press the BIOS key (usually Delete, F2, F10 or Esc), and look for Hardware Monitor, PC Health Status or the home dashboard. Many HP, Dell and Lenovo laptops also have a built-in diagnostics menu (often F2 or F12) with a CPU stress test.
Limitation: the BIOS only shows temperature before Windows loads, so you can’t see what a game does to your CPU. Treat it as an idle baseline, not a load test.
Which one should you pick? Start with Core Temp for a quick look. Install HWiNFO when you need to find the cause of throttling. Add Afterburner if you game.
How to Read the Numbers
You will see several temperature lines. Here is what matters:
Reading
Meaning
Look at it when
CPU Package
Overall CPU temperature
Always. Your main number
Core Max / hottest core
Hottest single core
Spotting uneven contact or paste
Tctl/Tdie (AMD)
AMD’s control/die temperature
Reading Ryzen chips
Core clocks
Current speed
Dropping clocks + high temp = throttling
Thermal throttling flag
Chip is limiting itself
Confirming heat is the cause
Rule of thumb: temperature that rises with load is normal. Temperature that rises while your clock speed falls means the CPU is protecting itself.
How to Run a Proper Heat Test
An idle reading does not prove your cooling works. Test under load:
Open HWiNFO (Sensors) or Core Temp and note the idle temperature after 5 minutes on the desktop.
Run a 10-minute Cinebench loop (or a long, CPU-heavy game session).
Watch the package temperature and core clocks.
Note the maximum temperature and whether clocks dropped.
Compare with the ranges above.
Pass: temperature settles and clocks stay steady. Fail: temperature climbs toward Tjmax and clocks fall.
Thermal Throttling vs CPU Bottleneck
These two get confused constantly because both feel like “my FPS dropped.”
Thermal throttling
CPU bottleneck
Cause
Heat
CPU too slow for the GPU
Pattern
Starts fine, gets worse after 10–20 min
Constant ceiling from the start
Temperature
High, near the limit
Normal
Clock speed
Drops as heat builds
Stays steady
CPU / GPU usage
Varies
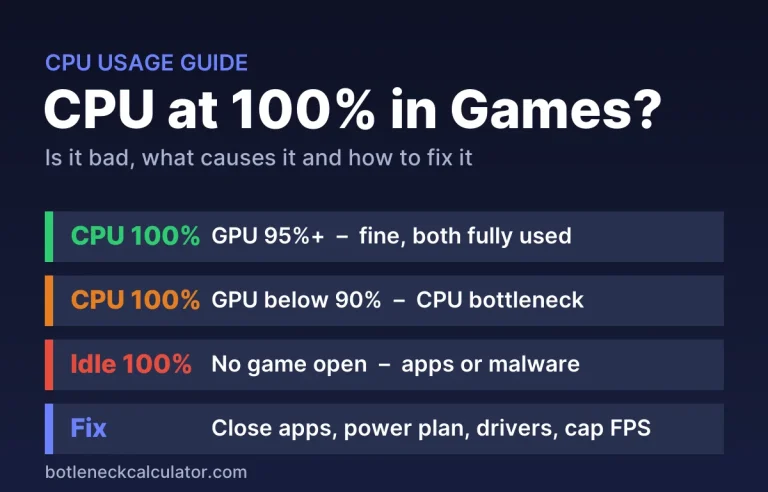
CPU near 100%, GPU well below
Fix
Better cooling, paste, airflow
Faster CPU, higher resolution/settings
How to tell in two minutes: open your monitoring overlay and play.
CPU at 100%, GPU stuck at 60–70% and temps normal → likely a CPU bottleneck.
GPU at about 99%, CPU well below → a GPU bottleneck. Your graphics card is the limit, which is normal and usually fine.
Temps above ~90°C and clocks suddenly fall → thermal throttling.
Buying a bigger cooler will not fix a true bottleneck processor, and a new CPU will not fix a throttling one. Diagnose first, spend second.
Does a Bottleneck Calculator Work?
A bottleneck calculator (sometimes called a bottleneck calc or bottleneck checker) takes your CPU and GPU, compares benchmark scores, and prints a percentage. A GPU bottleneck calculator or CPU bottleneck calculator is handy when you are planning a build, because you can swap parts and see which side looks weaker.
But treat it as a hint, not a verdict:
It compares two parts only. It does not know about heat, RAM, drivers or background apps.
The same pairing can be CPU-limited in one game and GPU-limited in another.
Resolution matters. At 1080p the CPU matters more; at 4K the GPU does most of the work.
A result of “0% bottleneck” just means no large mismatch was detected, not that your PC is perfect.
Best workflow: use a pc build bottleneck calculator while choosing parts, then verify with real bottleneck pc data (usage, 1% lows and temperatures) once the system is running. Our monitoring steps above give you that real data for free. For more on reading CPU and GPU usage and fixing a mismatch without buying new parts, see the bottleneck guides on our blog.
GPU Scheduling and Your CPU Load
Hardware-accelerated GPU scheduling lets the graphics card handle more of its own work scheduling instead of the CPU. In theory this reduces CPU overhead and can smooth frame times.
What to expect honestly: for most people the FPS change is small. It is still worth leaving on if your GPU supports it, because features such as DLSS Frame Generation need it enabled at the Windows level.
If you notice stutter, screen tearing or crashes after enabling it, update your GPU driver first, then turn it off if problems remain. Players with an 8 GB card in VRAM-heavy games should test both ways.
Which Graphics Card for a Gaming PC in 2026?
If you are building or upgrading, match the card to your resolution and CPU. A strong GPU on a weak processor wastes money, and a strong CPU on a weak GPU does too. Recent buying guides point to these picks (prices shift often, so check live listings):
Goal
Popular pick (2026)
Why
Budget 1080p
GeForce RTX 5050 / RTX 5060 8 GB
Lowest cost for solid 1080p
Best value, 1080p–1440p
Radeon RX 9060 XT 16 GB
More VRAM for the money
1440p / high-end value
Radeon RX 9070 / RX 9070 XT
Strong 1440p, much improved ray tracing
Two buying rules matter more than the model name:
Pick the GPU for the resolution you actually play at, not just the budget.
Check cooling. A powerful card plus a powerful CPU in a cramped case will throttle, no matter how good the parts are.
Before you buy, run your shortlist through the PC bottleneck calculator to see whether the new card suits your processor, and use the PSU wattage calculator to confirm your power supply can handle it. A bigger GPU also adds heat inside the case, so re-check your CPU temperature after the upgrade.
How to Lower CPU Temperature
Work through these in order. The first four are free.
Clean the dust from the heatsink, fans and case filters.
Check cooler mounting. The cooler must sit flat with firm, even contact.
Fix airflow: front/bottom intake, rear/top exhaust, and keep cables out of the way.
Reduce background load. Close apps that keep the CPU busy.
Adjust the fan curve in BIOS or fan-control software so fans ramp earlier.
Replace old thermal paste (every few years, sooner if temps rise over time).
Upgrade the cooler. High-power chips such as Core Ultra 9 or Ryzen 9 do best with a large tower air cooler or a 240/360 mm AIO.
Avoid unnecessary overclocking unless the cooler can handle the extra heat.
Mind the room. A CPU that idles at 35°C in winter may idle at 45°C in summer with no hardware change.
Laptop vs Desktop
Laptops overheat more easily because of their compact design and limited airflow. For laptops:
Use a hard, flat surface or a cooling stand, never a bed or sofa.
Clean vents regularly.
Use the manufacturer’s performance/fan modes.
Expect higher numbers: 80–90°C under load is common, but sustained 95°C+ deserves attention.
Common Mistakes to Avoid
Judging cooling by an idle reading only.
Reading just one core instead of CPU Package.
Installing several monitoring tools at once (they can conflict).
Downloading from unofficial sites. Use each tool’s official page.
Blaming a “bottleneck processor” when the real issue is heat.
Conclusion
Good CPU temperature monitoring takes ten minutes and saves you from guesswork. Install Core Temp or HWiNFO, run a load test, and compare the result with the ranges above. If temperatures are high and clocks fall, fix cooling. If temperatures are fine but the GPU sits low while the CPU is maxed out, you are looking at a CPU bottleneck instead. Knowing which one you have is the difference between a free fix and an expensive mistake.
FAQs
How do I monitor CPU temperature on Windows 10 or 11?
Install a free tool such as HWiNFO or Core Temp, then read CPU Package and per-core temperatures. Windows does not include a CPU temperature display, though Task Manager does show GPU temperature.
What is the best CPU temperature monitor?
HWiNFO is the most detailed and widely trusted. Core Temp is the easiest. HWMonitor is a good middle option.
How can I check CPU temperature without software?
Restart and open the BIOS/UEFI, then look under Hardware Monitor or PC Health. This shows only the pre-Windows temperature, so it cannot reveal load temperatures.
What is a good CPU temperature while gaming?
Roughly 60–85°C for most modern CPUs. Staying under about 85°C is comfortable. Regularly exceeding 90–95°C means your cooling is struggling.
What is a safe idle CPU temperature?
About 30–45°C on a desktop, depending on room temperature and cooler quality.
How do I monitor CPU temperature during gaming?
Use MSI Afterburner with RTSS to overlay temperature and usage in-game, or keep HWiNFO sensors open on a second monitor and check the Max column afterwards.
What happens if my CPU gets too hot?
It lowers its clock speed (thermal throttling), which causes stutter and lower FPS. Extreme or prolonged heat can cause crashes and shutdowns.
Is a bottleneck calculator accurate?
It gives a rough guide to whether a CPU and GPU are balanced, but not an exact FPS loss. Verify with real CPU/GPU usage and frame-time data.
How do I tell a CPU bottleneck from overheating?
A bottleneck is a constant ceiling with normal temperatures and the CPU near 100% while the GPU is low. Overheating shows high temperatures with falling clock speeds.
Should I turn GPU scheduling on?
For most supported systems, yes. The gain is usually small, but some features need it. Turn it off only if you see stutter or crashes after updating your drivers.
Can I monitor CPU temperature remotely?
Yes. Some tools (such as Core Temp add-ons or Libre Hardware Monitor’s web server) can share readings over the network. Only enable remote access on trusted networks.
Ameer Hamza builds and maintains Bottleneck Calculator. He writes the PC building and performance guides on this site and keeps its CPU, GPU and game requirement database up to date, using published benchmarks and official specs as sources. More about the site