
How Accurate Is Our Bottleneck Calculator? We Tested It
Last updated: November 2026
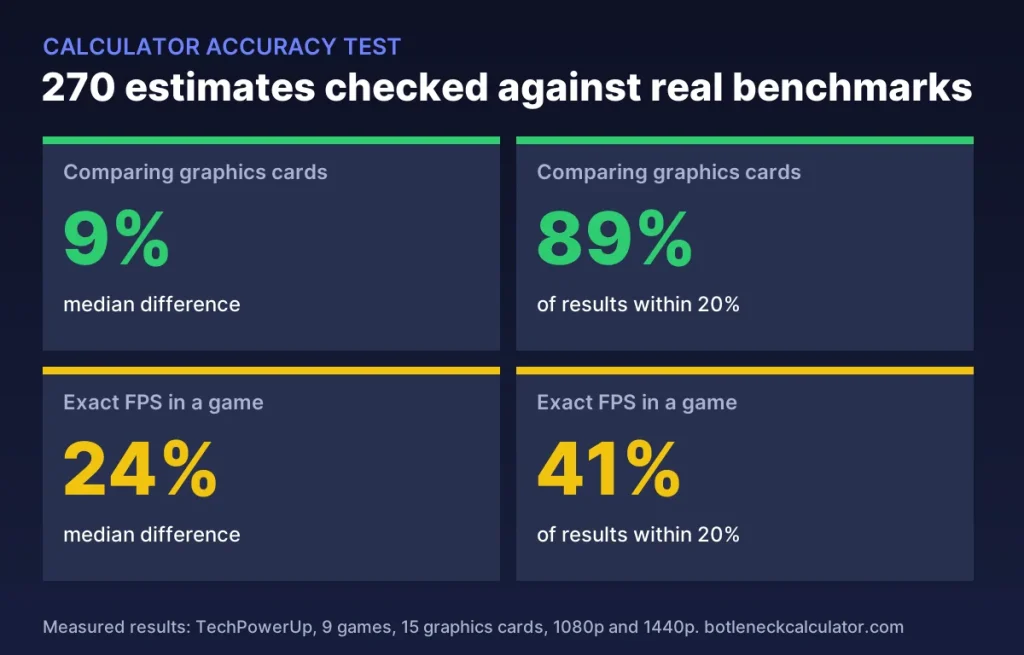
We compared 270 FPS estimates from our calculator with FPS measured by TechPowerUp in 9 games, on 15 graphics cards, at 1080p and 1440p. For comparing graphics cards with each other, our estimates were close: the median difference was 9%, and 89% of comparisons were within 20%. For the exact FPS in a game, the gap was bigger: the median difference was 24%, and 41% of estimates were within 20%.
In short: our bottleneck calculator and FPS calculator are good for comparing parts and finding what holds your PC back. Treat the exact FPS number as a rough guide, not a promise. Below is how we tested, every result, and where the calculator is weakest.
Table of ContentsShow or hide all 8 sectionsShowHide
Key results
| What we measured | Result |
|---|---|
| Results tested | 270 (9 games, 15 graphics cards, 1080p and 1440p) |
| Comparing graphics cards (relative speed) | Median difference 9%, average 10%, 89% within 20% |
| Exact FPS in a game | Median difference 24%, average 27%, 41% within 20%, 19% within 10% |
| Direction | Our FPS was on average 14% lower than measured |
How we tested
- Measured results: we used TechPowerUp’s Sapphire Radeon RX 9060 XT Pulse OC review, which tests many graphics cards on the same PC: a Ryzen 7 9800X3D, maximum game settings, no ray tracing, native resolution and no upscaling.
- Games and cards: we took the 9 games from that review that our FPS calculator has measured data for, and 15 popular graphics cards from NVIDIA, AMD and Intel.
- Our estimates: we ran our FPS calculator with the same setup: Ryzen 7 9800X3D, 32 GB of RAM, the Ultra preset, no upscaling, no ray tracing and no frame generation.
- Exact FPS check: for each result we worked out the difference as (our estimate − measured FPS) ÷ measured FPS.
- Card comparison check: we compared how fast each card is relative to the RX 9060 XT 16 GB in the same game and resolution, in both data sets. This shows how well the calculator ranks and scales cards.
We did not change the calculator after seeing these results. The numbers below are the calculator as it was in November 2026.
Results by game
| Game | Average difference | Within 20% | Our estimate is usually |
|---|---|---|---|
| Hogwarts Legacy | 11% | 83% | lower (-6%) |
| Kingdom Come: Deliverance II | 12% | 87% | lower (-8%) |
| Assassin’s Creed Shadows | 12% | 83% | about right (-2%) |
| Cyberpunk 2077 | 20% | 50% | lower (-20%) |
| Baldur’s Gate 3 | 23% | 37% | lower (-23%) |
| Starfield | 29% | 13% | lower (-29%) |
| Alan Wake 2 | 42% | 0% | lower (-42%) |
| The Witcher 3: Wild Hunt | 45% | 0% | lower (-45%) |
| Black Myth: Wukong | 48% | 13% | higher (+48%) |
The calculator was closest in Hogwarts Legacy, Kingdom Come: Deliverance II and Assassin’s Creed Shadows, where the average gap was about 11 to 12%. It was furthest off in Black Myth: Wukong, The Witcher 3 and Alan Wake 2, with average gaps of 42 to 48%.
Why some games are far off
- Different test scenes. TechPowerUp tests its own scene in each game. Our calculator is based on results from other reviews that used other scenes. A light or heavy part of a game can change FPS a lot.
- Different “maximum” settings. Our Ultra preset does not always match the highest preset of each game. In Black Myth: Wukong, for example, the measured FPS was much lower than our estimate, which points to heavier settings than ours.
- Game versions and updates. Patches, new game versions and new drivers can change performance after our data was collected.
These factors move all cards up or down together. That is why the calculator is much more accurate when you compare two cards than when you look at one exact FPS number.
What this means for you
- Good for: comparing two graphics cards or processors, seeing which part limits your PC, and getting a rough idea of whether a game will be playable or smooth.
- Less precise for: the exact FPS you will see in one specific scene of one game.
- Before you buy: check a review of your exact game as well, especially for very demanding games.
You can read how the estimates are made on our How We Calculate page. To learn what the results mean, see our CPU bottleneck and GPU bottleneck guides.
What this test does not cover
- All results used the fastest gaming CPU, so this test checks the graphics card side. It does not test CPU-limited cases or the bottleneck percentage itself.
- It covers 1080p and 1440p only, without ray tracing, upscaling or frame generation.
- It uses one review source. Other reviews with other scenes would give different numbers.
- It does not include laptop graphics.
We will update this page when we test against more data.
All 270 results
Show all results (measured FPS from TechPowerUp vs our estimate)
| Game | Resolution | Graphics card | Measured FPS | Our estimate | Difference |
|---|---|---|---|---|---|
| Cyberpunk 2077 | 1080p | RX 7800 XT | 135.1 | 109 | -19% |
| Cyberpunk 2077 | 1080p | RTX 3080 10 GB | 130.4 | 97 | -26% |
| Cyberpunk 2077 | 1080p | RX 6800 XT | 125.5 | 101 | -19% |
| Cyberpunk 2077 | 1080p | RTX 4070 | 119.4 | 99 | -17% |
| Cyberpunk 2077 | 1080p | RX 7700 XT | 115.8 | 95 | -18% |
| Cyberpunk 2077 | 1080p | RTX 5060 Ti 16 GB | 114.1 | 91 | -20% |
| Cyberpunk 2077 | 1080p | RX 9060 XT 16 GB | 111.5 | 80 | -28% |
| Cyberpunk 2077 | 1080p | RTX 3070 | 103.6 | 78 | -25% |
| Cyberpunk 2077 | 1080p | RTX 5060 | 102.2 | 74 | -28% |
| Cyberpunk 2077 | 1080p | RTX 4060 Ti 8 GB | 98.2 | 78 | -21% |
| Cyberpunk 2077 | 1080p | Arc B580 | 92.1 | 68 | -26% |
| Cyberpunk 2077 | 1080p | RTX 3060 Ti 8 GB | 89.0 | 66 | -26% |
| Cyberpunk 2077 | 1080p | RX 7600 | 78.6 | 62 | -21% |
| Cyberpunk 2077 | 1080p | RTX 4060 | 77.8 | 64 | -18% |
| Cyberpunk 2077 | 1080p | RTX 3060 12 GB | 68.5 | 56 | -18% |
| Cyberpunk 2077 | 1440p | RX 7800 XT | 87.9 | 78 | -11% |
| Cyberpunk 2077 | 1440p | RTX 3080 10 GB | 84.8 | 69 | -18% |
| Cyberpunk 2077 | 1440p | RX 6800 XT | 80.5 | 72 | -10% |
| Cyberpunk 2077 | 1440p | RTX 5060 Ti 16 GB | 76.8 | 65 | -15% |
| Cyberpunk 2077 | 1440p | RX 7700 XT | 75.1 | 68 | -10% |
| Cyberpunk 2077 | 1440p | RX 9060 XT 16 GB | 72.8 | 57 | -22% |
| Cyberpunk 2077 | 1440p | RTX 4070 | 70.5 | 71 | +0% |
| Cyberpunk 2077 | 1440p | RTX 3070 | 64.8 | 46 | -30% |
| Cyberpunk 2077 | 1440p | Arc B580 | 62.3 | 48 | -22% |
| Cyberpunk 2077 | 1440p | RTX 5060 | 62.1 | 43 | -30% |
| Cyberpunk 2077 | 1440p | RTX 4060 Ti 8 GB | 58.1 | 46 | -21% |
| Cyberpunk 2077 | 1440p | RTX 3060 Ti 8 GB | 55.0 | 39 | -30% |
| Cyberpunk 2077 | 1440p | RX 7600 | 49.6 | 37 | -26% |
| Cyberpunk 2077 | 1440p | RTX 4060 | 44.1 | 37 | -15% |
| Cyberpunk 2077 | 1440p | RTX 3060 12 GB | 41.6 | 40 | -4% |
| Alan Wake 2 | 1080p | RX 7800 XT | 100.5 | 60 | -41% |
| Alan Wake 2 | 1080p | RTX 3080 10 GB | 90.5 | 53 | -41% |
| Alan Wake 2 | 1080p | RX 6800 XT | 89.4 | 56 | -38% |
| Alan Wake 2 | 1080p | RTX 4070 | 86.8 | 54 | -38% |
| Alan Wake 2 | 1080p | RX 7700 XT | 84.9 | 52 | -39% |
| Alan Wake 2 | 1080p | RX 9060 XT 16 GB | 81.3 | 44 | -46% |
| Alan Wake 2 | 1080p | RTX 5060 Ti 16 GB | 75.0 | 50 | -33% |
| Alan Wake 2 | 1080p | RTX 3070 | 70.4 | 35 | -50% |
| Alan Wake 2 | 1080p | RTX 5060 | 66.1 | 33 | -50% |
| Alan Wake 2 | 1080p | RTX 4060 Ti 8 GB | 66.0 | 35 | -47% |
| Alan Wake 2 | 1080p | RTX 3060 Ti 8 GB | 61.1 | 30 | -52% |
| Alan Wake 2 | 1080p | Arc B580 | 57.8 | 37 | -36% |
| Alan Wake 2 | 1080p | RX 7600 | 57.2 | 28 | -51% |
| Alan Wake 2 | 1080p | RTX 4060 | 50.6 | 29 | -43% |
| Alan Wake 2 | 1080p | RTX 3060 12 GB | 46.2 | 31 | -34% |
| Alan Wake 2 | 1440p | RX 7800 XT | 69.9 | 43 | -39% |
| Alan Wake 2 | 1440p | RTX 3080 10 GB | 66.4 | 38 | -43% |
| Alan Wake 2 | 1440p | RTX 4070 | 62.8 | 39 | -38% |
| Alan Wake 2 | 1440p | RX 6800 XT | 62.0 | 40 | -36% |
| Alan Wake 2 | 1440p | RX 7700 XT | 59.6 | 37 | -38% |
| Alan Wake 2 | 1440p | RX 9060 XT 16 GB | 57.6 | 31 | -46% |
| Alan Wake 2 | 1440p | RTX 5060 Ti 16 GB | 54.1 | 36 | -34% |
| Alan Wake 2 | 1440p | RTX 3070 | 51.2 | 25 | -51% |
| Alan Wake 2 | 1440p | RTX 4060 Ti 8 GB | 47.3 | 25 | -47% |
| Alan Wake 2 | 1440p | RTX 5060 | 47.1 | 24 | -50% |
| Alan Wake 2 | 1440p | RTX 3060 Ti 8 GB | 43.7 | 21 | -52% |
| Alan Wake 2 | 1440p | Arc B580 | 41.9 | 27 | -37% |
| Alan Wake 2 | 1440p | RX 7600 | 37.6 | 20 | -47% |
| Alan Wake 2 | 1440p | RTX 4060 | 36.0 | 20 | -43% |
| Alan Wake 2 | 1440p | RTX 3060 12 GB | 33.1 | 22 | -34% |
| Assassin’s Creed Shadows | 1080p | RX 7800 XT | 58.4 | 63 | +8% |
| Assassin’s Creed Shadows | 1080p | RX 6800 XT | 54.4 | 59 | +8% |
| Assassin’s Creed Shadows | 1080p | RTX 4070 | 53.7 | 57 | +7% |
| Assassin’s Creed Shadows | 1080p | RX 7700 XT | 49.7 | 55 | +11% |
| Assassin’s Creed Shadows | 1080p | RX 9060 XT 16 GB | 48.8 | 46 | -5% |
| Assassin’s Creed Shadows | 1080p | RTX 3080 10 GB | 44.5 | 56 | +26% |
| Assassin’s Creed Shadows | 1080p | RTX 5060 Ti 16 GB | 42.8 | 53 | +23% |
| Assassin’s Creed Shadows | 1080p | RTX 4060 Ti 8 GB | 40.1 | 37 | -8% |
| Assassin’s Creed Shadows | 1080p | RTX 5060 | 37.4 | 35 | -6% |
| Assassin’s Creed Shadows | 1080p | RTX 3070 | 36.4 | 37 | +2% |
| Assassin’s Creed Shadows | 1080p | Arc B580 | 35.9 | 39 | +9% |
| Assassin’s Creed Shadows | 1080p | RX 7600 | 35.7 | 30 | -17% |
| Assassin’s Creed Shadows | 1080p | RTX 3060 Ti 8 GB | 33.2 | 31 | -6% |
| Assassin’s Creed Shadows | 1080p | RTX 4060 | 31.3 | 30 | -3% |
| Assassin’s Creed Shadows | 1080p | RTX 3060 12 GB | 24.9 | 32 | +30% |
| Assassin’s Creed Shadows | 1440p | RX 7800 XT | 49.5 | 45 | -9% |
| Assassin’s Creed Shadows | 1440p | RX 6800 XT | 45.4 | 42 | -8% |
| Assassin’s Creed Shadows | 1440p | RTX 4070 | 43.5 | 41 | -6% |
| Assassin’s Creed Shadows | 1440p | RX 7700 XT | 43.3 | 39 | -9% |
| Assassin’s Creed Shadows | 1440p | RX 9060 XT 16 GB | 39.3 | 33 | -16% |
| Assassin’s Creed Shadows | 1440p | RTX 3080 10 GB | 37.2 | 40 | +8% |
| Assassin’s Creed Shadows | 1440p | RTX 5060 Ti 16 GB | 33.9 | 38 | +11% |
| Assassin’s Creed Shadows | 1440p | RTX 4060 Ti 8 GB | 33.1 | 26 | -20% |
| Assassin’s Creed Shadows | 1440p | Arc B580 | 31.4 | 28 | -11% |
| Assassin’s Creed Shadows | 1440p | RTX 3070 | 31.0 | 26 | -15% |
| Assassin’s Creed Shadows | 1440p | RTX 5060 | 30.8 | 25 | -19% |
| Assassin’s Creed Shadows | 1440p | RX 7600 | 29.1 | 21 | -27% |
| Assassin’s Creed Shadows | 1440p | RTX 3060 Ti 8 GB | 25.8 | 22 | -13% |
| Assassin’s Creed Shadows | 1440p | RTX 4060 | 25.0 | 22 | -13% |
| Assassin’s Creed Shadows | 1440p | RTX 3060 12 GB | 20.3 | 23 | +14% |
| Baldur’s Gate 3 | 1080p | RX 7800 XT | 167.0 | 138 | -17% |
| Baldur’s Gate 3 | 1080p | RX 6800 XT | 165.8 | 128 | -23% |
| Baldur’s Gate 3 | 1080p | RTX 4070 | 165.1 | 125 | -24% |
| Baldur’s Gate 3 | 1080p | RTX 3080 10 GB | 156.8 | 123 | -22% |
| Baldur’s Gate 3 | 1080p | RX 7700 XT | 148.5 | 120 | -19% |
| Baldur’s Gate 3 | 1080p | RTX 5060 Ti 16 GB | 136.7 | 115 | -16% |
| Baldur’s Gate 3 | 1080p | RX 9060 XT 16 GB | 132.3 | 101 | -24% |
| Baldur’s Gate 3 | 1080p | RTX 3070 | 128.1 | 98 | -23% |
| Baldur’s Gate 3 | 1080p | RTX 4060 Ti 8 GB | 124.0 | 98 | -21% |
| Baldur’s Gate 3 | 1080p | RTX 5060 | 121.1 | 93 | -23% |
| Baldur’s Gate 3 | 1080p | RTX 3060 Ti 8 GB | 108.3 | 83 | -23% |
| Baldur’s Gate 3 | 1080p | RTX 4060 | 97.1 | 81 | -17% |
| Baldur’s Gate 3 | 1080p | RX 7600 | 96.3 | 79 | -18% |
| Baldur’s Gate 3 | 1080p | Arc B580 | 90.8 | 86 | -6% |
| Baldur’s Gate 3 | 1080p | RTX 3060 12 GB | 86.9 | 71 | -18% |
| Baldur’s Gate 3 | 1440p | RX 6800 XT | 121.0 | 92 | -24% |
| Baldur’s Gate 3 | 1440p | RX 7800 XT | 120.0 | 99 | -18% |
| Baldur’s Gate 3 | 1440p | RTX 3080 10 GB | 118.9 | 88 | -26% |
| Baldur’s Gate 3 | 1440p | RTX 4070 | 117.2 | 89 | -24% |
| Baldur’s Gate 3 | 1440p | RX 7700 XT | 108.9 | 86 | -21% |
| Baldur’s Gate 3 | 1440p | RTX 5060 Ti 16 GB | 100.0 | 82 | -18% |
| Baldur’s Gate 3 | 1440p | RX 9060 XT 16 GB | 94.5 | 72 | -24% |
| Baldur’s Gate 3 | 1440p | RTX 3070 | 91.2 | 58 | -37% |
| Baldur’s Gate 3 | 1440p | RTX 5060 | 87.9 | 55 | -38% |
| Baldur’s Gate 3 | 1440p | RTX 4060 Ti 8 GB | 87.7 | 58 | -34% |
| Baldur’s Gate 3 | 1440p | RTX 3060 Ti 8 GB | 78.2 | 49 | -38% |
| Baldur’s Gate 3 | 1440p | RX 7600 | 68.7 | 46 | -33% |
| Baldur’s Gate 3 | 1440p | Arc B580 | 68.5 | 61 | -11% |
| Baldur’s Gate 3 | 1440p | RTX 4060 | 67.7 | 47 | -30% |
| Baldur’s Gate 3 | 1440p | RTX 3060 12 GB | 61.4 | 51 | -18% |
| Black Myth: Wukong | 1080p | RTX 4070 | 45.4 | 68 | +49% |
| Black Myth: Wukong | 1080p | RTX 3080 10 GB | 45.0 | 66 | +48% |
| Black Myth: Wukong | 1080p | RX 7800 XT | 42.5 | 75 | +76% |
| Black Myth: Wukong | 1080p | RTX 5060 Ti 16 GB | 42.3 | 62 | +48% |
| Black Myth: Wukong | 1080p | RX 6800 XT | 38.5 | 69 | +80% |
| Black Myth: Wukong | 1080p | RX 7700 XT | 37.5 | 65 | +74% |
| Black Myth: Wukong | 1080p | RX 9060 XT 16 GB | 37.4 | 55 | +46% |
| Black Myth: Wukong | 1080p | RTX 4060 Ti 8 GB | 36.3 | 53 | +47% |
| Black Myth: Wukong | 1080p | RTX 3070 | 35.6 | 53 | +50% |
| Black Myth: Wukong | 1080p | RTX 5060 | 35.5 | 51 | +42% |
| Black Myth: Wukong | 1080p | RTX 3060 Ti 8 GB | 30.7 | 45 | +47% |
| Black Myth: Wukong | 1080p | RTX 4060 | 28.0 | 44 | +56% |
| Black Myth: Wukong | 1080p | Arc B580 | 25.1 | 46 | +85% |
| Black Myth: Wukong | 1080p | RX 7600 | 24.9 | 43 | +71% |
| Black Myth: Wukong | 1080p | RTX 3060 12 GB | 23.2 | 38 | +65% |
| Black Myth: Wukong | 1440p | RTX 3080 10 GB | 35.6 | 47 | +33% |
| Black Myth: Wukong | 1440p | RTX 4070 | 35.0 | 48 | +38% |
| Black Myth: Wukong | 1440p | RX 7800 XT | 33.3 | 53 | +60% |
| Black Myth: Wukong | 1440p | RTX 5060 Ti 16 GB | 32.4 | 45 | +38% |
| Black Myth: Wukong | 1440p | RX 6800 XT | 30.6 | 50 | +62% |
| Black Myth: Wukong | 1440p | RX 7700 XT | 29.2 | 46 | +59% |
| Black Myth: Wukong | 1440p | RX 9060 XT 16 GB | 28.2 | 39 | +38% |
| Black Myth: Wukong | 1440p | RTX 3070 | 27.3 | 31 | +14% |
| Black Myth: Wukong | 1440p | RTX 4060 Ti 8 GB | 27.2 | 31 | +15% |
| Black Myth: Wukong | 1440p | RTX 5060 | 27.1 | 30 | +9% |
| Black Myth: Wukong | 1440p | RTX 3060 Ti 8 GB | 23.5 | 26 | +12% |
| Black Myth: Wukong | 1440p | RTX 4060 | 20.8 | 26 | +23% |
| Black Myth: Wukong | 1440p | Arc B580 | 19.7 | 33 | +68% |
| Black Myth: Wukong | 1440p | RX 7600 | 18.4 | 25 | +36% |
| Black Myth: Wukong | 1440p | RTX 3060 12 GB | 17.6 | 27 | +56% |
| Hogwarts Legacy | 1080p | RTX 3080 10 GB | 94.6 | 92 | -3% |
| Hogwarts Legacy | 1080p | RX 6800 XT | 92.4 | 96 | +4% |
| Hogwarts Legacy | 1080p | RTX 4070 | 89.8 | 94 | +4% |
| Hogwarts Legacy | 1080p | RX 7800 XT | 89.7 | 103 | +15% |
| Hogwarts Legacy | 1080p | RTX 5060 Ti 16 GB | 84.6 | 86 | +2% |
| Hogwarts Legacy | 1080p | RX 7700 XT | 81.5 | 90 | +11% |
| Hogwarts Legacy | 1080p | RTX 3070 | 80.3 | 61 | -25% |
| Hogwarts Legacy | 1080p | RX 9060 XT 16 GB | 79.1 | 76 | -4% |
| Hogwarts Legacy | 1080p | RTX 5060 | 73.7 | 57 | -22% |
| Hogwarts Legacy | 1080p | RTX 4060 Ti 8 GB | 71.1 | 61 | -15% |
| Hogwarts Legacy | 1080p | RTX 3060 Ti 8 GB | 67.1 | 51 | -24% |
| Hogwarts Legacy | 1080p | Arc B580 | 61.0 | 64 | +5% |
| Hogwarts Legacy | 1080p | RTX 4060 | 58.3 | 50 | -15% |
| Hogwarts Legacy | 1080p | RX 7600 | 57.3 | 48 | -16% |
| Hogwarts Legacy | 1080p | RTX 3060 12 GB | 49.8 | 53 | +7% |
| Hogwarts Legacy | 1440p | RX 6800 XT | 75.6 | 69 | -9% |
| Hogwarts Legacy | 1440p | RX 7800 XT | 72.8 | 74 | +1% |
| Hogwarts Legacy | 1440p | RTX 3080 10 GB | 69.9 | 66 | -6% |
| Hogwarts Legacy | 1440p | RTX 4070 | 63.5 | 67 | +5% |
| Hogwarts Legacy | 1440p | RX 7700 XT | 62.0 | 64 | +4% |
| Hogwarts Legacy | 1440p | RTX 5060 Ti 16 GB | 60.5 | 62 | +2% |
| Hogwarts Legacy | 1440p | RX 9060 XT 16 GB | 57.7 | 54 | -6% |
| Hogwarts Legacy | 1440p | RTX 3070 | 56.2 | 43 | -23% |
| Hogwarts Legacy | 1440p | RTX 4060 Ti 8 GB | 51.7 | 43 | -16% |
| Hogwarts Legacy | 1440p | RTX 5060 | 51.1 | 41 | -20% |
| Hogwarts Legacy | 1440p | RTX 3060 Ti 8 GB | 50.6 | 37 | -28% |
| Hogwarts Legacy | 1440p | Arc B580 | 45.7 | 46 | +1% |
| Hogwarts Legacy | 1440p | RTX 4060 | 40.6 | 35 | -13% |
| Hogwarts Legacy | 1440p | RX 7600 | 40.1 | 35 | -14% |
| Hogwarts Legacy | 1440p | RTX 3060 12 GB | 36.6 | 38 | +4% |
| Kingdom Come: Deliverance II | 1080p | RTX 4070 | 117.0 | 104 | -11% |
| Kingdom Come: Deliverance II | 1080p | RTX 3080 10 GB | 116.1 | 102 | -12% |
| Kingdom Come: Deliverance II | 1080p | RTX 5060 Ti 16 GB | 104.2 | 96 | -8% |
| Kingdom Come: Deliverance II | 1080p | RX 7800 XT | 103.2 | 115 | +11% |
| Kingdom Come: Deliverance II | 1080p | RX 6800 XT | 98.7 | 107 | +8% |
| Kingdom Come: Deliverance II | 1080p | RX 9060 XT 16 GB | 97.3 | 84 | -14% |
| Kingdom Come: Deliverance II | 1080p | RTX 5060 | 94.9 | 78 | -18% |
| Kingdom Come: Deliverance II | 1080p | RTX 3070 | 92.9 | 82 | -12% |
| Kingdom Come: Deliverance II | 1080p | RX 7700 XT | 91.7 | 100 | +9% |
| Kingdom Come: Deliverance II | 1080p | RTX 4060 Ti 8 GB | 91.7 | 82 | -11% |
| Kingdom Come: Deliverance II | 1080p | RTX 3060 Ti 8 GB | 81.2 | 69 | -15% |
| Kingdom Come: Deliverance II | 1080p | Arc B580 | 78.0 | 71 | -8% |
| Kingdom Come: Deliverance II | 1080p | RTX 4060 | 72.9 | 67 | -8% |
| Kingdom Come: Deliverance II | 1080p | RX 7600 | 66.2 | 66 | -1% |
| Kingdom Come: Deliverance II | 1080p | RTX 3060 12 GB | 62.0 | 59 | -5% |
| Kingdom Come: Deliverance II | 1440p | RTX 3080 10 GB | 83.8 | 73 | -13% |
| Kingdom Come: Deliverance II | 1440p | RTX 4070 | 81.0 | 74 | -8% |
| Kingdom Come: Deliverance II | 1440p | RX 7800 XT | 76.0 | 82 | +8% |
| Kingdom Come: Deliverance II | 1440p | RTX 5060 Ti 16 GB | 71.8 | 69 | -4% |
| Kingdom Come: Deliverance II | 1440p | RX 6800 XT | 71.7 | 76 | +6% |
| Kingdom Come: Deliverance II | 1440p | RX 9060 XT 16 GB | 67.1 | 60 | -11% |
| Kingdom Come: Deliverance II | 1440p | RX 7700 XT | 65.0 | 72 | +10% |
| Kingdom Come: Deliverance II | 1440p | RTX 3070 | 64.9 | 48 | -26% |
| Kingdom Come: Deliverance II | 1440p | RTX 5060 | 63.2 | 46 | -28% |
| Kingdom Come: Deliverance II | 1440p | RTX 4060 Ti 8 GB | 62.3 | 48 | -23% |
| Kingdom Come: Deliverance II | 1440p | RTX 3060 Ti 8 GB | 55.8 | 41 | -27% |
| Kingdom Come: Deliverance II | 1440p | Arc B580 | 53.6 | 51 | -5% |
| Kingdom Come: Deliverance II | 1440p | RTX 4060 | 47.8 | 39 | -18% |
| Kingdom Come: Deliverance II | 1440p | RX 7600 | 43.9 | 38 | -12% |
| Kingdom Come: Deliverance II | 1440p | RTX 3060 12 GB | 42.2 | 42 | -0% |
| Starfield | 1080p | RX 7800 XT | 89.0 | 69 | -23% |
| Starfield | 1080p | RTX 4070 | 88.9 | 62 | -30% |
| Starfield | 1080p | RTX 3080 10 GB | 82.6 | 61 | -26% |
| Starfield | 1080p | RX 6800 XT | 79.7 | 64 | -20% |
| Starfield | 1080p | RTX 5060 Ti 16 GB | 73.6 | 58 | -22% |
| Starfield | 1080p | RX 7700 XT | 70.5 | 60 | -15% |
| Starfield | 1080p | RX 9060 XT 16 GB | 70.0 | 50 | -28% |
| Starfield | 1080p | RTX 4060 Ti 8 GB | 68.8 | 49 | -28% |
| Starfield | 1080p | RTX 3070 | 66.0 | 49 | -25% |
| Starfield | 1080p | RTX 5060 | 65.5 | 47 | -29% |
| Starfield | 1080p | RTX 3060 Ti 8 GB | 57.6 | 42 | -28% |
| Starfield | 1080p | RTX 4060 | 53.2 | 40 | -24% |
| Starfield | 1080p | Arc B580 | 51.5 | 43 | -17% |
| Starfield | 1080p | RX 7600 | 49.3 | 39 | -20% |
| Starfield | 1080p | RTX 3060 12 GB | 42.8 | 35 | -17% |
| Starfield | 1440p | RTX 4070 | 70.3 | 45 | -37% |
| Starfield | 1440p | RX 7800 XT | 68.8 | 49 | -28% |
| Starfield | 1440p | RTX 3080 10 GB | 65.9 | 44 | -34% |
| Starfield | 1440p | RX 6800 XT | 61.5 | 46 | -26% |
| Starfield | 1440p | RTX 5060 Ti 16 GB | 57.8 | 41 | -29% |
| Starfield | 1440p | RX 7700 XT | 56.1 | 43 | -24% |
| Starfield | 1440p | RX 9060 XT 16 GB | 54.8 | 36 | -34% |
| Starfield | 1440p | RTX 4060 Ti 8 GB | 53.2 | 29 | -46% |
| Starfield | 1440p | RTX 3070 | 51.5 | 29 | -44% |
| Starfield | 1440p | RTX 5060 | 50.6 | 27 | -46% |
| Starfield | 1440p | RTX 3060 Ti 8 GB | 44.8 | 24 | -46% |
| Starfield | 1440p | RTX 4060 | 40.5 | 24 | -42% |
| Starfield | 1440p | Arc B580 | 38.5 | 31 | -20% |
| Starfield | 1440p | RX 7600 | 37.7 | 23 | -39% |
| Starfield | 1440p | RTX 3060 12 GB | 33.4 | 25 | -24% |
| The Witcher 3: Wild Hunt | 1080p | RTX 4070 | 229.7 | 125 | -46% |
| The Witcher 3: Wild Hunt | 1080p | RTX 3080 10 GB | 227.4 | 123 | -46% |
| The Witcher 3: Wild Hunt | 1080p | RX 7800 XT | 219.0 | 138 | -37% |
| The Witcher 3: Wild Hunt | 1080p | RX 6800 XT | 218.6 | 128 | -41% |
| The Witcher 3: Wild Hunt | 1080p | RX 7700 XT | 204.1 | 120 | -41% |
| The Witcher 3: Wild Hunt | 1080p | RTX 5060 Ti 16 GB | 200.3 | 115 | -42% |
| The Witcher 3: Wild Hunt | 1080p | RTX 3070 | 182.1 | 98 | -46% |
| The Witcher 3: Wild Hunt | 1080p | RTX 4060 Ti 8 GB | 177.8 | 98 | -45% |
| The Witcher 3: Wild Hunt | 1080p | RTX 5060 | 177.3 | 93 | -47% |
| The Witcher 3: Wild Hunt | 1080p | Arc B580 | 172.7 | 86 | -50% |
| The Witcher 3: Wild Hunt | 1080p | RX 9060 XT 16 GB | 171.6 | 101 | -41% |
| The Witcher 3: Wild Hunt | 1080p | RTX 3060 Ti 8 GB | 158.0 | 83 | -47% |
| The Witcher 3: Wild Hunt | 1080p | RTX 4060 | 139.7 | 81 | -42% |
| The Witcher 3: Wild Hunt | 1080p | RX 7600 | 132.9 | 79 | -41% |
| The Witcher 3: Wild Hunt | 1080p | RTX 3060 12 GB | 116.5 | 71 | -39% |
| The Witcher 3: Wild Hunt | 1440p | RTX 3080 10 GB | 178.6 | 88 | -51% |
| The Witcher 3: Wild Hunt | 1440p | RTX 4070 | 172.2 | 89 | -48% |
| The Witcher 3: Wild Hunt | 1440p | RX 7800 XT | 169.7 | 99 | -42% |
| The Witcher 3: Wild Hunt | 1440p | RX 6800 XT | 169.6 | 92 | -46% |
| The Witcher 3: Wild Hunt | 1440p | RTX 5060 Ti 16 GB | 151.1 | 82 | -45% |
| The Witcher 3: Wild Hunt | 1440p | RX 7700 XT | 150.0 | 86 | -43% |
| The Witcher 3: Wild Hunt | 1440p | RTX 3070 | 139.0 | 70 | -49% |
| The Witcher 3: Wild Hunt | 1440p | RTX 5060 | 131.5 | 67 | -49% |
| The Witcher 3: Wild Hunt | 1440p | Arc B580 | 130.9 | 61 | -53% |
| The Witcher 3: Wild Hunt | 1440p | RTX 4060 Ti 8 GB | 129.1 | 70 | -46% |
| The Witcher 3: Wild Hunt | 1440p | RX 9060 XT 16 GB | 126.2 | 72 | -43% |
| The Witcher 3: Wild Hunt | 1440p | RTX 3060 Ti 8 GB | 120.2 | 59 | -51% |
| The Witcher 3: Wild Hunt | 1440p | RTX 4060 | 101.8 | 58 | -43% |
| The Witcher 3: Wild Hunt | 1440p | RX 7600 | 96.0 | 56 | -41% |
| The Witcher 3: Wild Hunt | 1440p | RTX 3060 12 GB | 88.9 | 51 | -43% |
Sources: TechPowerUp – Sapphire Radeon RX 9060 XT Pulse OC 16 GB review (game test pages, 1080p and 1440p). Our estimates come from our FPS calculator as of November 2026.
Frequently asked questions
Are bottleneck calculators accurate?
They are useful for comparing parts, but not exact. In our test, comparisons between graphics cards had a median difference of 9%, while exact FPS numbers had a median difference of 24%. Be careful with any calculator that does not show how accurate it is.
Why is my FPS different from the calculator?
Your game scene, settings, game version, drivers, temperatures and background apps all change FPS. The calculator gives a typical estimate, not a measurement of your PC.
Is the bottleneck percentage exact?
No. It is an estimate of how much one part limits the other. Use it to see which part to upgrade first, not as a precise number. This test checked the FPS side of the model, not the percentage.
Which data did you test against?
Measured FPS from TechPowerUp’s Radeon RX 9060 XT Pulse review, which tests many cards on one PC with the same settings. We list every result on this page.
Will you improve the calculator?
Yes. Games with large gaps show us where the data needs work. When we change the calculator, we will test it again and update this page.